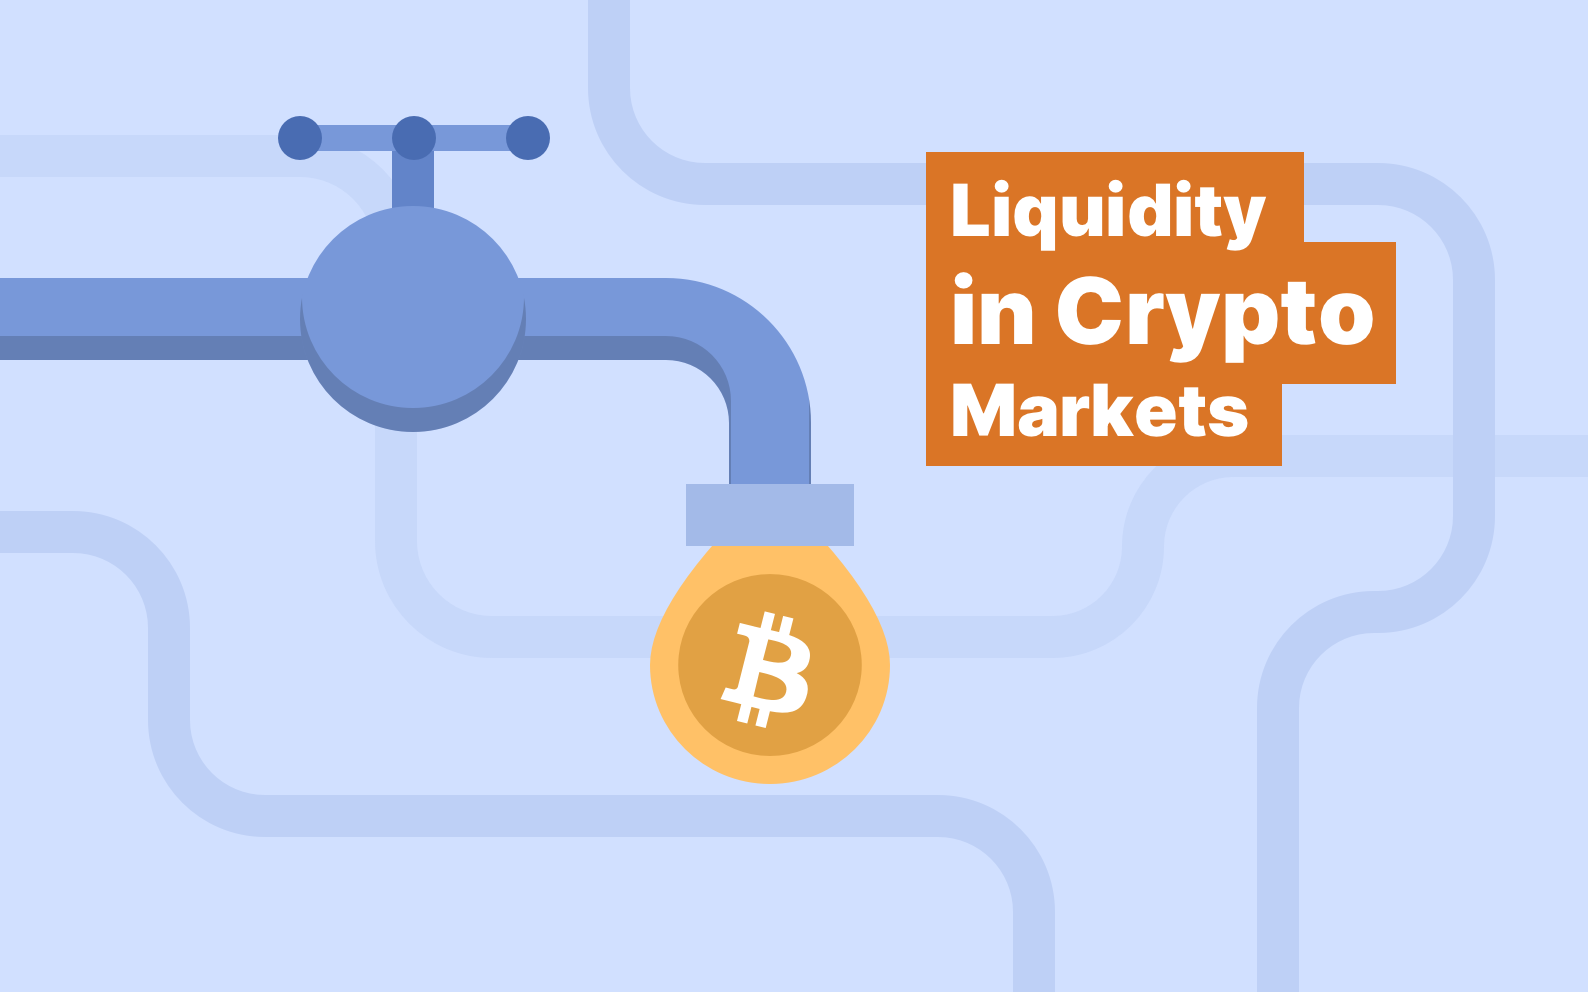
Liquidity in crypto markets is the ease with which a digital asset can be bought or sold without moving its price. In 2026, deep liquidity is the dividing line between institutional-grade assets and speculative ones. Bitcoin spot ETFs alone now hold roughly $117 billion in assets, equal to about 6.5% of Bitcoin’s total market cap, according to SoSoValue’s ETF dashboard and broader market trackers. That structural depth is reshaping how traders, custodians, and developers think about execution.
This guide breaks down what crypto liquidity is, why it matters, how it is measured, where it comes from, and where it is going. Each section answers one specific question, with current data and direct references to authoritative sources.
What is Liquidity in Cryptocurrency?

iquidity in cryptocurrency measures how quickly an asset can be converted into cash or another token without moving the price. A liquid asset has many active buyers and sellers, narrow bid-ask spreads, and minimal slippage on large orders. Bitcoin and Ethereum sit at the top of the liquidity ladder. Most niche altcoins sit near the bottom.
Liquidity is not the same as price. A token can be expensive and illiquid, or cheap and highly liquid. The right test is execution. If a $1 million sale moves the price by less than a fraction of a percent, the asset is liquid. If a $10,000 order causes a 5% drop, the asset is illiquid.
According to a 2025 BitGo research note, three signals from traditional markets anchor liquidity in crypto too: bid-ask spread, order book depth near the mid-price, and price impact for a given order size. The added complexity in crypto is 24/7 trading and dozens of competing venues.
This shapes investment outcomes directly. In highly liquid markets, traders react quickly to news. In illiquid ones, exits become traps.
Why Does Liquidity Matter in Crypto Markets?
Liquidity matters because it determines what every trade actually costs and how much risk sits in your portfolio. Tight spreads, deep order books, and predictable execution lower transaction costs and reduce manipulation risk. Thin markets do the opposite. They widen spreads, raise slippage, and make exits harder during stress events. Here is what high liquidity unlocks.
1. Price Stability
Liquid markets absorb large orders without violent price swings. A deep order book at the best bid and ask means a $10 million trade can clear with less than 0.1% price impact, a benchmark that Caleb & Brown’s 2026 liquidity analysis calls the hallmark of a mature digital asset.
The opposite cycle plays out in thin markets. One large sell order shifts the price several percent. Other holders panic-sell. The slide accelerates. Bitcoin’s deep order books in 2025 and early 2026 helped prevent the “liquidity holes” that triggered cascading liquidations in earlier cycles.
2. Lower Transaction Costs
The bid-ask spread on liquid pairs is now measured in basis points, not pips. On the most active Bitcoin and Ethereum pairs, the 30-day median spread on US spot ETFs has narrowed to record lows, often comparable to the S&P 500 in 2026. Tight spreads mean traders pay less to enter and exit positions, which encourages higher volume and reinforces liquidity.
Wider spreads on small-cap altcoins do the reverse. A 1% round-trip spread can eat half a year of yield in a DeFi vault. Spread is the silent tax on illiquid markets.
3. Enhanced Market Entry and Exit
High liquidity lets traders execute strategies on demand instead of waiting for counterparties. This matters most during volatile windows. When news breaks, a position you cannot exit becomes a position you cannot value. Highly liquid assets let you adjust exposure in seconds. Illiquid assets force you to wait, sometimes through losses you cannot stop.
This is also why portfolio managers measure liquidity before they buy. An asset you can buy easily but cannot sell easily is a poor fit for any disciplined strategy. Robust portfolio and exposure risk monitoring workflows treat liquidity as a first-class metric, not an afterthought.
4. Reduced Market Manipulation
Deep liquidity makes manipulation expensive. Small markets are vulnerable to wash trading, pump-and-dump schemes, and spoofing. The volume needed to move price is too low. Once a coin reaches multi-billion-dollar liquidity, those tactics break against the order book. The cost of moving the market exceeds the profit.
Regulators care for the same reason. The European Union’s Markets in Crypto-Assets (MiCA) framework explicitly targets manipulation in regulated venues. Authorized exchanges must monitor order books and report abusive patterns.
What are the Types of Liquidity?

Crypto liquidity comes in five distinct forms, each with its own dynamics. Market liquidity, asset liquidity, network liquidity, DeFi liquidity, and stablecoin liquidity all interact. A single token can be liquid on one exchange and illiquid on another. Understanding which type you are looking at is the first step to managing risk.
1. Market Liquidity
Market liquidity is the depth of buy and sell orders across an entire venue or the broader crypto market. Major centralized exchanges like Binance, Coinbase, and Kraken offer the deepest order books. Per Kaiko Research, Binance reached 300 million registered users in December 2025 and now processes over $20 billion in daily spot volume across roughly 1,630 trading pairs.
Smaller exchanges and DEXs have shallower books. The same asset can trade with tight spreads on Coinbase and wide spreads on a regional venue.
2. Asset Liquidity
Asset liquidity is specific to a single coin or token. Bitcoin and Ethereum have the highest asset liquidity due to extensive adoption and broad exchange support. New altcoins typically launch with low asset liquidity, sometimes only one or two trading pairs. Asset liquidity rises as listings, market makers, and trading volume grow.
3. Network Liquidity
Network liquidity is the ability of a blockchain to settle trades quickly and cheaply. High network fees and congestion reduce effective liquidity even for popular assets. Layer 2 scaling solutions on Ethereum, including Arbitrum, Optimism, and Base, have improved network liquidity by reducing settlement costs to fractions of a cent on most transactions.
4. DeFi Liquidity
DeFi liquidity sits inside smart contracts called liquidity pools. Users deposit token pairs, and traders swap against the pool. Per DefiLlama, total value locked across DeFi sat in the $95 to $140 billion range as of mid-April 2026, depending on whether liquid staking tokens were counted. Ethereum hosted roughly half of that.
5. Stablecoin Liquidity
Stablecoin liquidity is the on-chain dollar layer that funds most crypto trades. Tether and Circle’s USDC dominate, with combined market caps in the hundreds of billions. A 2025 IMF working paper treats stablecoin flows as a major component of cross-border digital liquidity. Without stablecoins, most spot pairs would lose their primary settlement currency.
What Factors Affect Crypto Liquidity?

Six factors drive crypto liquidity in 2026: trading volume, market depth, exchange access, regulation, technology, and institutional capital. Each one has shifted noticeably since the spot ETF approvals in early 2024 and the full MiCA rollout in late 2024. The table below summarizes the directional impact.
| Factor | Effect on Liquidity | 2026 Trend |
|---|---|---|
| Trading volume | Higher volume narrows spreads | Q1 2026 CEX volumes fell 48% from October 2025 peak |
| Market depth | Deeper books reduce slippage | 0.1% depth recovered faster than 1% depth post-FTX |
| Exchanges and ETFs | More venues widen access | Spot ETFs now act as a new “secondary” tier |
| Regulation | Clear rules attract capital | MiCA full enforcement deadline July 1, 2026 |
| Technology | Faster settlement increases depth | Layer 2 throughput keeps growing |
| Institutional capital | ETFs and treasuries add depth | BTC ETFs hold ~$117B; ETH ETFs ~$19B |
1. Trading Volume
Trading volume is the cleanest single proxy for liquidity, but it can mislead. Wash trading and high-frequency churn inflate raw volume. Deep order book depth is now considered the truer signal in 2026. Per CryptoQuant data summarized by Reel Financial, centralized exchange volumes fell 48% from their October 2025 peak to about $4.3 trillion by March 2026, the lowest level since late 2024.
2. Market Depth
Market depth is the cumulative buy and sell volume sitting near the mid-price. Kaiko measures “1% depth” as the dollar amount available within a 1% price move. A high 1% depth means large trades clear without moving the market significantly. Since the FTX collapse, market makers have shifted liquidity closer to the mid-price, with 0.1% depth recovering faster than wider bands.
3. Number of Exchanges and ETFs
The more venues an asset trades on, the more liquid it tends to be. Bitcoin and Ethereum trade on hundreds of exchanges plus 11 spot ETFs in the United States. Spot ETFs added a new “secondary liquidity tier” in 2024 by integrating crypto into traditional brokerages like Morgan Stanley and Vanguard. ETF redemption mechanisms now link traditional finance directly to crypto spot markets.
4. Regulatory Environment
Regulatory clarity attracts institutional capital, which deepens liquidity. The European Union’s MiCA framework entered full force in December 2024, with the grandfathering deadline closing on July 1, 2026. Per a recent Crypto.news regulatory analysis, roughly 18% of European crypto platforms have already exited the market, while licensed exchanges consolidate the remaining liquidity.
In the United States, the CLARITY Act and a new SEC and CFTC memorandum aim to end jurisdictional turf wars and deepen domestic liquidity pools.
5. Technological Advancements
Faster, cheaper settlement directly increases effective liquidity. Layer 2 scaling solutions on Ethereum have cut transaction costs sharply. Crypto bridges move tokens between chains, expanding cross-venue liquidity. AMM protocols like Uniswap V4 introduced “hooks” that let liquidity providers customize fee logic, drawing more capital into pools.
6. Institutional Capital Flows
Institutional flows now set the pace of crypto liquidity during US market hours. Kaiko research shows weekday Bitcoin volumes consistently double weekend levels, driven by ETF activity. This creates a two-tier market. Deep liquidity during weekdays, fragmented liquidity on weekends and holidays. The shift toward structured crypto investment policies of big firms is now built into market microstructure.
How Do You Measure Liquidity in Crypto Markets?

Five metrics give a complete picture of crypto liquidity: trading volume, bid-ask spread, market depth, slippage, and turnover ratio. Each captures a different angle. Combining all five removes blind spots. Tools like Kaiko, DefiLlama, CoinMarketCap, CoinGecko, and DEXTools surface these metrics in real time.
1. Trading Volume
24-hour and 7-day volume are the easiest starting points. CoinMarketCap and CoinGecko publish them for almost every listed asset. Higher is better, but always compare against the same asset’s history rather than absolute numbers. Sudden volume spikes can signal news, manipulation, or both.
2. Bid-Ask Spread
The spread is the difference between the best bid and the best ask. Narrower is more liquid. On Bitcoin and Ethereum spot pairs at major venues, spreads sit in single-digit basis points. On low-cap tokens, spreads of 1% or more are common.
3. Market Depth
Order book depth shows the dollar volume sitting at each price level. A “10% depth” of $50 million means $50 million of buy and sell orders sit within 10% of the mid-price. Kaiko’s research shows that 0.1% depth has recovered faster than 1% depth since the FTX collapse, suggesting market makers now concentrate liquidity closer to the mid-price.
4. Slippage
Slippage is the gap between the expected price and the executed price. Highly liquid markets keep slippage near zero. On thin markets, a six-figure trade can slip several percent. BitGo’s 2025 liquidity guide recommends measuring slippage on real trades rather than relying on quoted spreads, which can disappear once orders interact with the book.
5. Turnover Ratio
The turnover ratio compares 24-hour volume to total market cap. A ratio of 5% means one-twentieth of the asset’s value changed hands that day. Healthy assets typically sit between 2% and 15%. Anything below 0.5% is a warning sign for new investors.
What are the Sources of Liquidity in Crypto?

Crypto liquidity flows from seven main sources: centralized exchanges, decentralized exchanges, market makers, liquidity pools, institutional investors, lending platforms, and stablecoin issuers. Each plays a distinct role. Together they form the layered infrastructure that makes 24/7 global trading possible.
1. Centralized Exchanges
Centralized exchanges (CEXs) like Binance, Coinbase, and Kraken match millions of orders daily through internal order books. Per CryptoQuant data via Reel Financial, Binance handled $248 billion in spot volume in March 2026, holding a 32% market share. Smaller venues like OKX, Bybit, MEXC, and Crypto.com fill out the rest.
2. Decentralized Exchanges
Decentralized exchanges (DEXs) like Uniswap, PancakeSwap, and Curve match trades through automated market makers (AMMs) instead of order books. Liquidity comes from user-funded pools, not professional firms. Perpetual DEXs such as Hyperliquid have rapidly gained derivatives market share in 2026, per Kaiko’s 2026 outlook.
3. Market Makers
Market makers post continuous buy and sell quotes to keep markets two-sided. Firms like Wintermute, GSR, and Jump Crypto run quoting algorithms across hundreds of pairs. Their presence narrows spreads and absorbs short-term imbalances. Without them, even major exchanges would see wider intraday spreads.
4. Liquidity Pools
Liquidity pools are the backbone of DeFi. Users deposit token pairs into smart contracts and earn a share of trading fees. Per DefiLlama, Aave V3 alone holds about $26.18 billion in protocol TVL as of mid-April 2026, making it the largest DeFi protocol by capital. Lido sits second at roughly $23 billion.
5. Institutional Investors
Hedge funds, asset managers, and sovereign wealth desks now make up a meaningful share of crypto liquidity. Crypto hedge funds deploy strategies that range from arbitrage to directional bets. Spot ETFs have made it easier for traditional capital to enter the market, though flows can reverse quickly during stress events.
6. Crypto Lending and Borrowing Platforms
Lending platforms like Aave, Compound, and Morpho add liquidity by letting users borrow against collateral. The borrowed capital often re-enters trading markets, providing another flow of liquidity. Lending markets also help absorb sudden swings in demand. Disruptions on lending platforms can ripple through DeFi liquidity quickly.
7. Stablecoin Issuers
Stablecoin issuers like Tether, Circle, and PayPal create the dollar-denominated liquidity that funds most crypto trades. Stablecoin market caps now exceed $200 billion in aggregate. The IMF treats stablecoin flows as central to global on-chain trading and digital payments. Without stablecoins, spot pairs would lose their primary settlement currency overnight.
What are the Challenges to Liquidity in Crypto Markets?

Five structural challenges still hold crypto liquidity below the level of mature equity markets. Volatility, regulatory unevenness, technological bottlenecks, weekend liquidity drops, and venue fragmentation all add friction. Each one is improving, but none has been fully solved.
- Venue fragmentation: 24/7 trading across hundreds of CEXs and DEXs means prices and depth differ across venues. Smaller venues and thin pairs are most affected. October 2025 saw a tariff-related sell-off create a $643 cross-exchange Bitcoin price spread that lasted several minutes.
- Volatility: Sharp moves drain liquidity by spooking market makers, who pull quotes during stress. Per Kaiko, Bitcoin’s 15% drop in late January 2026 from $88,000 to $74,500 triggered roughly $7 billion in liquidations.
- Regulatory unevenness: Different jurisdictions enforce different rules. Cross-border order flow gets fragmented. Chainalysis flagged regulatory fragmentation as the biggest 2026 challenge for international crypto businesses.
- Technological bottlenecks: Network congestion and high gas fees still hit smaller chains during peak demand. Bridge exploits also damage cross-chain liquidity. The April 2026 KelpDAO bridge exploit triggered a $13.21 billion DeFi TVL drop in 48 hours, per CoinDesk.
- Weekend liquidity drops: Institutional flow concentrates during US weekday hours. Kaiko found weekday Bitcoin volumes consistently double weekend volumes, leading to wider spreads and higher slippage outside core hours.
Vezgo: The Crypto API

Vezgo provides a single API to aggregate balance, position, and transaction data across centralized exchanges, decentralized exchanges, blockchains, wallets, and NFTs. That unified data foundation is what powers the dashboards traders and platforms use to evaluate liquidity exposure across an entire portfolio. Instead of querying twenty different exchange APIs, developers integrate once with Vezgo.
The Vezgo API covers more than 300 venues. Developers retrieving balances, positions, and transactions across that footprint can build portfolio and exposure risk monitoring dashboards that flag concentration in illiquid tokens, unusual cross-chain dependencies, or oversized positions in low-depth pairs. The API normalizes data formats, so liquidity-relevant fields like position size, trade history, and venue identifiers stay consistent across providers.
Security underpins the platform. Advanced encryption techniques safeguard transmissions, multi-factor authentication protects keys, and SOC 2 Type 2 compliance backs the operational controls. Platform builders can also leverage support for NFTs when their portfolios extend beyond fungible tokens.
The API is built for portfolio trackers, tax and accounting tools, compliance platforms, and any application where liquidity-aware data drives decisions. Clear documentation and responsive support keep integration time low.
FAQs
Here are answers to some of the most frequently asked questions about liquidity in crypto:


Leave a Reply